

Fintech is evolving faster than ever, steep competition, user trust demands, and shifting regulations make every product decision matter. Fortunately, Mixpanel’s “2025 State of Product Analytics | Fintech” offers a data-backed lens into what’s really driving performance across 2,533 fintech companies, 2.22 trillion events, and 5.84 billion users. Here are the 10 must-track metrics, anchored in real insight.
1. Daily & Monthly Active Users (DAU & MAU)
- Why it matters: Think of DAU and MAU as your app’s heartbeat and circulation; DAU shows day-to-day health, MAU reveals longer-term vitality. Their ratio (DAU/MAU), known as stickiness, reflects how consistently users return.
- Benchmark: A DAU/MAU ratio above 20% is considered strong across industries; B2B apps often aim for closer to 40%
- Takeaway: Aim to increase that DAU/MAU ratio with daily value drivers, like alerts or quick-check features, to turn casual users into habitual customers.
2. Time to First Transaction (TTFT)
- Why it matters: This metric captures how fast your users reach the “aha” moment and is a crucial metric in fintech where trust builds through action.
- Insight: While not benchmarked directly, every day you cut off onboarding friction translates into higher retention and less drop-off.
- Takeaway: Map your onboarding funnel end-to-end, identify friction points, and experiment with micro-improvements like pre-filled KYC or trigger-based nudges.
3. API Usage
- Why it matters: If your product offers integrations, API usage is like the electrical wiring, powering ecosystem value and developer adoption.
- Insight: Higher API usage typically signals trust, deeper integration, and stickier B2B relationships.
- Takeaway: Measure request volumes, endpoints used, and errors. Prioritize docs, uptime, and onboarding for your most used endpoints to drive developer-driven growth.
4. Support Requests (Volume & Resolution Time)
- Why it matters: Support tickets are your app’s smoke detectors, they show where something’s burning, even if quietly.
- Insight: Spikes often align with rate limit changes, confusing UX, or funnel drop-offs.
- Takeaway: Tag and analyze support tickets by category. A recurring payment confusion or dashboard symptom shouldn’t be handled one-by-one, it needs design or help-text fixes.
5. Stickiness (DAU/MAU Ratio)
- Why it matters: Reiterating this ratio helps see if your app is more than a one-hit wonder.
- Insight: Products with ratios above 20% are generally considered “top-tier” in engagement health
- Takeaway: Launch features that bring users back every day, budget insights, newsfeed, alert preferences and then monitor how these impact stickiness.
6. Revenue-Linked Metrics (ARPU / Transaction Volume)
- Why it matters: While engagement is great, monetization is what makes your product sustainable.
- Insight: Mixpanel enables linking product behavior directly to payments or revenue events.
- Takeaway: Track ARPU and ranged cohorts. Spot power users and plan upsell paths or detect under-monetized heavy users for tailored premium offers.
7. Week 1 Retention
- Why it matters: The first week is usually your stickiness crucible, i.e. if users stay beyond onboarding, they’re likely to stick.
- Benchmark: In fintech, week 1 retention often beats other verticals, with around 27% retention at week one, and 15% after one year
- Takeaway: Re-engage using meaningful nudges, transaction reminders, timely emails, or educational prompts right before users dropout.
8. Session Frequency
- Why it matters: Session count fuels churn forecasts; more sessions usually mean higher loyalty and monetization opportunity.
- Insight: Frequent users tend to convert higher and generate more product feedback loops.
- Takeaway: Monitor week-over-week session frequency trends. Falling cadence? Time for updated triggers or regular learning touchpoints (e.g., auto alerts).
9. Customer Lifetime Value (CLTV)
- Why it matters: CLTV is your strategic north star, how much future business your users represent.
- Insight: Long-standing users are often 3–5× more valuable than new users when normalized for behavior and ARPU.
- Takeaway: Align marketing and acquisition cost models with your CLTV projections. Promote referrals or loyalty programs for higher LTV cohorts.
10. Feature Adoption Rate
- Why it matters: Launching features isn’t enough with the number of available Fintech apps. Uptake is what really counts.
- Insight: Even small feature gains can shift ARPU and stickiness dramatically over time.
- Takeaway: Tag core features in analytics and track cohort usage rates. Promote via in-app modals, walkthroughs, and A/B tests, track over time and refine.
Putting It All Together
Think of your fintech product metrics like a fitness tracker for your business: the raw numbers (steps, heart rate) only make sense when you compare them to the right baseline and act on what you learn.
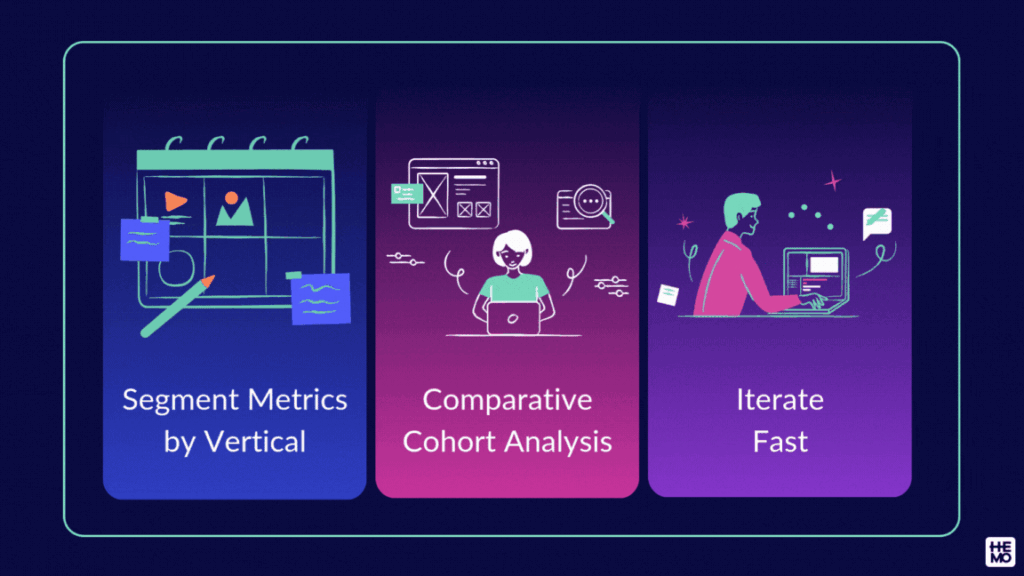
1. Segment Metrics by Vertical
Not all fintech products run the same race. Banking apps are like marathon runners, aiming for steady, long-term endurance in user trust. Crypto apps are sprinters, chasing rapid spikes in activity and growth. If you’re judging a marathoner by sprint times, you’ll draw the wrong conclusions.
Action: Always compare your growth, retention, and engagement to others in your specific vertical. A “good” metric in wealth management may be underperforming in payments, and vice versa.
2. Run Comparative Cohort Analysis
Cohort analysis is like hosting a dinner party where you group guests by shared traits, you’ll quickly see who bonds, who drifts off, and who comes back for seconds. In fintech, cohorts might be users acquired during a specific campaign, from a certain channel, or using a particular feature.
Action: Compare these cohorts to see what actually drives retention and engagement in your product. Maybe your “free trial” group sticks around longer than those acquired via discounts. That’s your signal to double down on the former.
3. Iterate Fast
If your metrics are a GPS, you can’t just watch the map, you need to turn the wheel. When retention lags behind benchmarks, that’s a detour warning. Don’t wait for quarterly reviews; adjust onboarding flows, tweak UX copy, or experiment with new monetization loops immediately.
Action: Build an agile experimentation habit. The quicker you test and adapt, the less costly each wrong turn becomes.
Our Thoughts
Fintech metrics need to be accurate, not comprehensive. Mixpanel’s 2025 benchmark data gives you clear north stars, growth rates, retention, and feature usage, backed by billions of real user signals.
At HEMOdata, we’ve worked closely with financial services and fintech companies across the Middle East for the past three years, helping them put these metrics into practice. Through our partnership with Mixpanel, we’ve supported product and growth teams in tracking engagement, conversion, and retention with greater precision.
Want to see how your product stacks up and discover growth opportunities rooted in the numbers?
Download the 2025 Fintech Product Analytics Benchmark Report