

Most companies can tell you what’s happening on their digital channels. But understanding why is still a challenge
- Why did users drop off in onboarding?
- Why did one experiment succeed and another fail?
- Why do certain teams seem disconnected from business KPIs?
Mixpanel’s latest set of feature expansions is designed around answering those questions. By tying product analytics closer to real-world behavior and business outcomes, these updates give product, growth, and data teams the clarity they need to move from insight to action.
Let’s explore what’s new at Mixpanel and how these features can transform different industries.
Heatmaps
What it is:
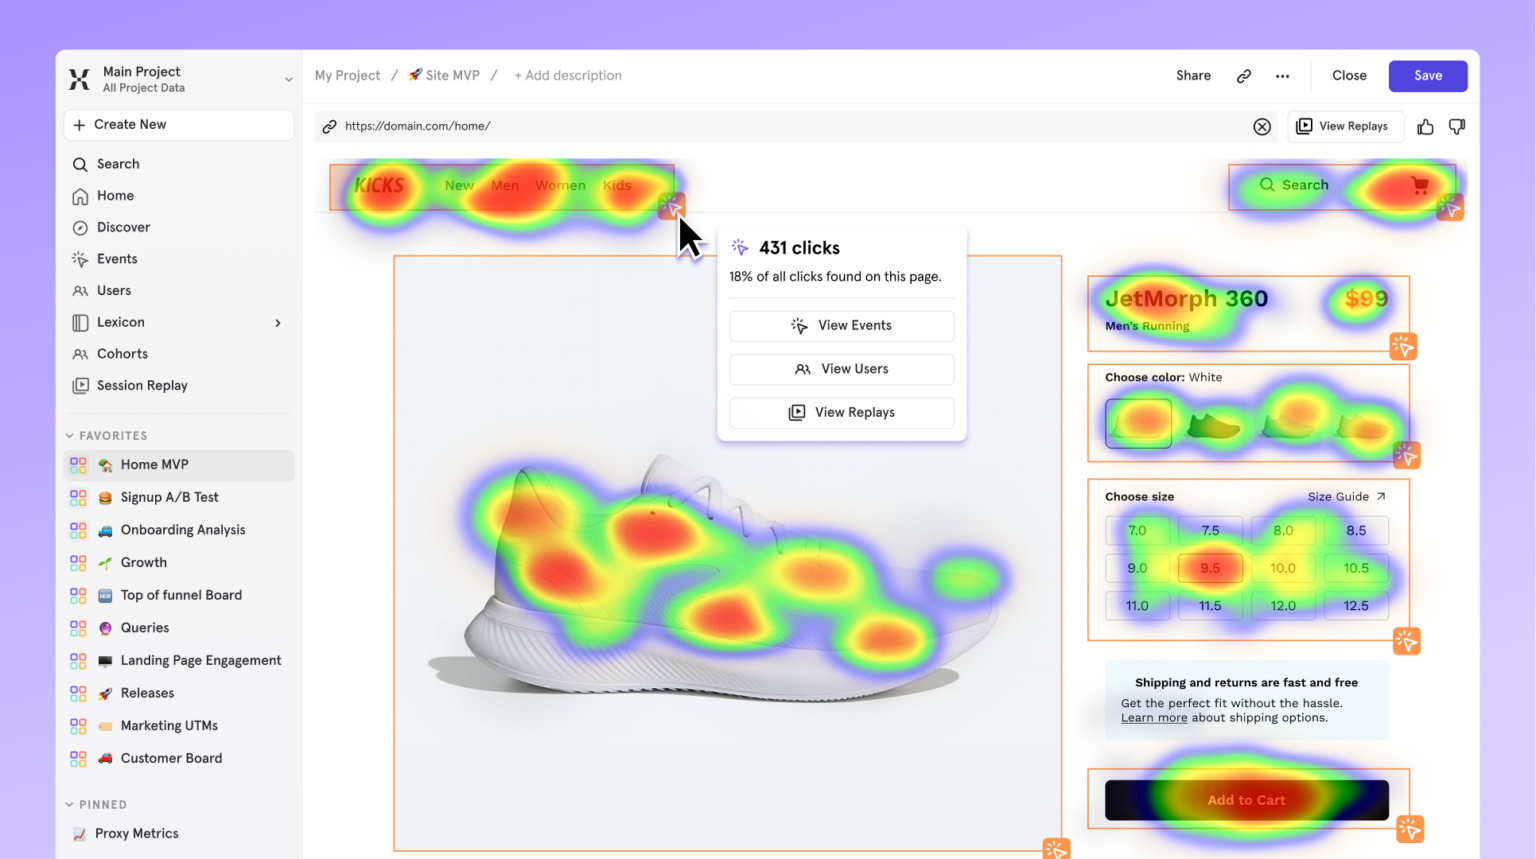
Heatmaps are a new visualization layer included with Mixpanel’s Session Replay. Instead of just watching individual user sessions one at a time, Heatmaps aggregate hundreds (or thousands) of sessions into a single visual map, showing where user attention is focused. They show where users click, tap, scroll, or hesitate the most. Areas of high interaction are hot (bright colors), while ignored or confusing areas are cold.
What makes Mixpanel’s Heatmaps unique is that they’re directly tied to your existing analytics events. That means you’re not just seeing where people clicked and how those clicks connect to outcomes like sign-ups, purchases, or feature adoption.
Why it matters:
- Traditional funnel reports show you where drop-offs happen but not why. Heatmaps fill that gap.
- Even small UX issues, like hidden CTAs or confusing navigation, can lead to significant revenue loss.
Impact for teams:
- Fintech: Identify where users abandon digital KYC or payment forms.
- E-commerce: Spot if “Add to Cart” buttons are ignored because they’re below the fold.
- Media & Streaming: See if subscription prompts distract users from content.
With Heatmaps plus Session Replay, teams now get both granular behavior insights and the full context of the user journey.
Mobile Session Replay: Full-Funnel Visibility Across Devices
What it is:
Session Replay for iOS and Android now complements web replays, giving you a unified view of user experience across different platforms.
Why it matters:
- In mobile-first markets, users often begin on web and complete key actions on mobile. Without visibility into both, product teams are flying blind.
- Bugs, confusing navigation, or long load times on mobile often lead to silent churn.
Session Replay makes it easy to filter by cohorts or events, instead of having to scan through millions of replays.
Experimentation Reporting 2.0
What it is:
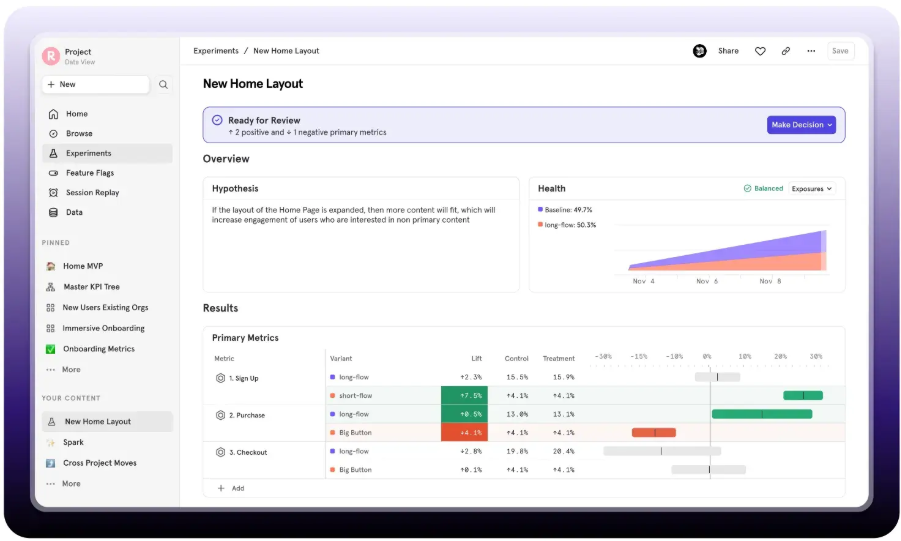
Experimentation Reporting is Mixpanel’s way of turning raw A/B test data into clear, contextual experiment insights. With the 2.0 update, you can measure experiment results against any metric your team already tracks inside Mixpanel, whether that’s conversion rate, retention, CLTV, or custom events.
Why it matters:
- Setting up A/B tests is quite straight forward. Once we run these tests, understanding if the results are statistically significant and business-relevant is the real challenge.
- Mixpanel’s reporting ties outcomes back to actual user behavior flows. You can see how a test impacted multiple touchpoints: Did retention improve? Did users spend more time in-app? Did it reduce rage clicks? Plus, the platform automatically applies statistical significance testing so you know whether results are reliable.
Impact for teams:
- Fintech: Measure whether a redesigned payments flow improves conversion and long-term retention.
- E-commerce: See if personalized discount experiments increase CLTV or just short-term sales.
- Media: Track whether new recommendation algorithms actually drive more time on the platform.
This is experimentation with context that turns raw significance tests into actionable growth strategies.
(Enterprise add-on feature)
Metric Trees
What it is:
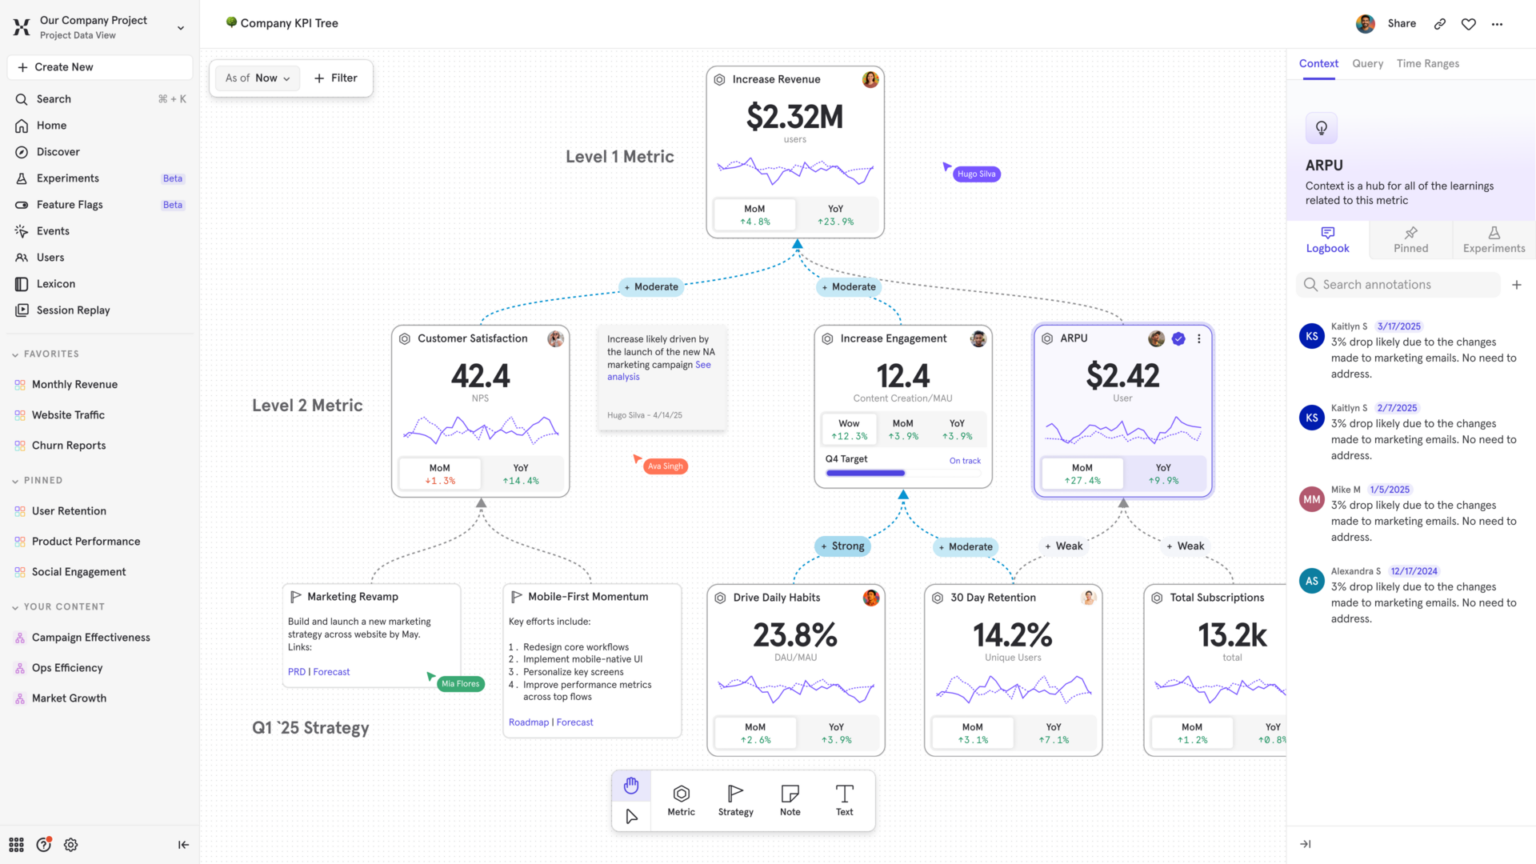
Metric Trees are Mixpanel’s new way to give organizations a single map of their growth strategy. Think of it like an org chart, but for metrics.
At the top, you have your company’s north-star KPIs (like ARR, retention, or DAU). Beneath that, branches connect team-level initiatives and supporting metrics. Each branch shows how smaller inputs (like onboarding completion, feature adoption, or payment success rates) ladder up to big outcomes.
Metric Trees make your KPIs actionable. You can:
- Assign owners to each metric.
- Drill down into time-over-time performance.
- Track the ripple effects of experiments across different levels.
Why it matters:
- It gives your different departments the evidence they need to showcase to leadership how their efforts contribute towards key business objectives
Impact for teams:
- Fintech: Connect metrics like “active wallets” or “KYC completion” to revenue and retention.
- E-commerce: Show how product detail page optimization influences conversions and gross merchandise value (GMV).
- Media: Tie new content launches to subscription growth or ad impressions.
Metric Trees bring accountability, transparency, and agility by assigning owners to each metric and highlighting what’s really driving growth.
(Enterprise add-on feature)
More Features, Less Problems
Mixpanel has also rolled out several incremental but powerful improvements:
- Rage Clicks in Session Replay – Autocapture user frustration without manual tagging.
- Saved Metrics – Standardize definitions so every team is aligned.
- Custom Project Homepage – Personalize your workflow by setting any Board as your default view.
Collectively these updates reduce friction, increase trust in data, and keep teams aligned.
Final Thoughts
The real strength of Mixpanel’s new feature set lies in answering the why:
- Why are users frustrated? (Heatmaps + Rage Clicks)
- Why are cohorts behaving differently? (Mobile + Web Session Replay)
- Why did this experiment succeed or fail? (Experimentation Reporting)
- Why do some initiatives drive growth while others stall? (Metric Trees)
At HEMOdata, we’ve seen firsthand how these features empower teams across the Middle East to turn questions into clarity, and clarity into growth.
👉 Curious how these updates could apply to your business? Talk to us now. As Mixpanel’s regional partner, we’ll help you put them into practice.